Visualize Data Smarter: 1 Day Power BI & Tableau Course in Adelaide
Date & Time
📅 Fri, Feb 20, 2026
🕐 10:30 PM
Ends: Sat, Feb 21, 2026 at 6:30 AM
Location
📍 Regus-Adelaide, Spaces Wayville
3 Greenhill Road Ph No: 61(0) 2 80155605, Wayville, SA 5034, Australia, Wayville, SA, 5034
🏙️ Adelaide
About This Event
Turn raw data into compelling stories—master Power BI and Tableau to build stunning, interactive dashboards that drive smarter decisions.
Bring your team and save:
1. Groups of three or more receive a 10% discount
2. Organizations hosting an in-house session with 10+ participants enjoy a 15% discount.
Duration: 1 Full Day (8 Hours)
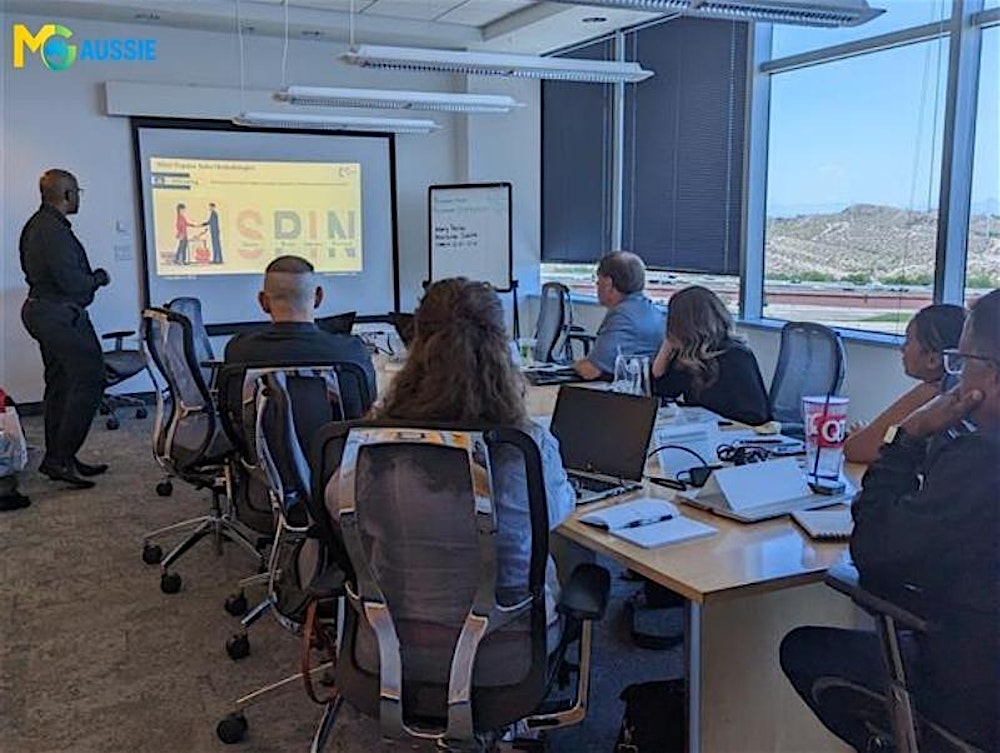
Delivery Mode: Classroom (In-Person)
Language: English
Credits: 8 PDUs/Training Hours
Certification: Course Completion Certificate
Refreshments: Lunch, Snacks and beverages will be provided during the session
Course Overview:
The Data Visualization (Power BI & Tableau) course enables you to turn complex data into compelling stories and visual dashboards using the most popular visualization tools in the industry. Learn how to import, clean, and visualize data using Power BI and Tableau, while creating dynamic dashboards and reports that support data-informed decision-making.
Learning Objectives:
By the end of this course, you will be able to:
- Import and transform data in Power BI and Tableau
- Build interactive visual dashboards aligned with business goals
- Apply visualization best practices for audience engagement
- Use calculated fields and DAX formulas where necessary
- Create and share compelling data stories with stakeholders
- Understand which tool to apply for different analytics scenarios
Who can Attend?
Data analysts, business intelligence professionals, and decision-makers.
Why Choose this Course?
This course is ideal for professionals looking to make a greater impact with data-driven storytelling. Whether you're already analyzing data or moving into visual analytics, this hands-on training will help you create dashboards that capture attention and drive strategic conversations. With practical comparison of Power BI and Tableau, you’ll understand the strengths of each tool and leave with the confidence to choose the right platform for your business needs.
©2025 MG Aussie Events. This content is protected by copyright law. Copy or Reproduction without permission is prohibited.
Want to enable your team to visualize and communicate insights more effectively?
We offer customized in-house data visualization training using the tools your organization uses most. Curious how Power BI or Tableau can transform your reporting culture? Let us design a practical workshop for your data and business needs.
Contact us today to schedule a customized in-house, face-to-face session: eventbrite@mgaussie.com
How do you want to get there?
Regus-Adelaide, Spaces Wayville
3 Greenhill Road Ph No: 61(0) 2 80155605, Wayville, SA 5034, Australia, Wayville, SA, 5034
Open in Google MapsTickets
AUD 524.38 - 688.50
Good to Know
Duration
8 hours
Refund Policy
Refunds up to 7 days before event
Organized by
More from MG Aussie

Behavior and Emotional Support: 1 Day Workshop in Sydney
Sun, Mar 15, 2026
AUD 572.03 - 741.45

Freelance Proposal Boost: 1 Day Training Session in Sydney
Sun, Mar 15, 2026
AUD 572.03 - 741.45

Visualize Data Smarter: 1 Day Power BI & Tableau Course in Sydney
Sun, Mar 15, 2026
AUD 619.67 - 794.39

DASA DevOps Fundamentals 2.0: 2 Days Workshop | Sydney
Sun, Mar 15, 2026
AUD 1191.45 - 1535.58
More Events in Adelaide
View All Events
LEARN TO PAINT WITH GRANULATING WATERCOLOURS
Sun, Mar 15, 2026
Adelaide
AUD 150.00

Emu Day @ Woodhouse Adventure Park
Sun, Mar 15, 2026
Adelaide
AUD 27.78

Permaculture in Practice: A Year of Skills & Sustainability with Kym Ormond
Sun, Mar 15, 2026
Adelaide
AUD 0.00 - 5.00

Jewellery Workshop-Organic 999 Silver Ring Making with Stone
Sun, Mar 15, 2026
Adelaide
AUD 185.00 - 195.00

Lead With Truth, Live With Purpose Workshop
Sun, Mar 15, 2026
Adelaide
AUD 75.00

Drawing Birds Workshop
Sun, Mar 15, 2026
Adelaide
AUD 22.49